Iren Group activities that lead to environmental impacts include:
- production of hydroelectric and thermoelectric energy (co-generation and traditional plants, supplementary and reserve plants) and solar energy;
- management of electricity distribution networks (high, medium and low voltage and transformer substations), and natural gas distribution networks;
- management of the integrated water service;
- waste collection, recovery and disposal services;
- other customer services (including energy efficiency products and services, electric mobility);
- environmental practices of contractors, subcontractors and other suppliers of the Group.
Resources are used in these operating areas for the management of operating activities and outputs and impacts are generated, as illustrated in the following diagram.

Direct and indirect energy consumption
The direct energy consumption of the Group concerns the use of fuels for the production of electricity and heat at the plants (co-generation plants, thermal plants, boilers, waste-to-energy plants and landfills), as well as the non-renewable primary energy flows not directly associated with the production of energy (i.e. site heating, fuel for the Group’s vehicle fleet, etc.), used in carrying out its activities.
In 2020, direct energy consumption showed a 3% reduction compared to 2019, related to the overall lower electricity and heat production driven by climate effects and domestic energy consumption contraction associated with the Covid-19 crisis.
Indirect energy consumption (electricity purchased and consumed by the Group) refers to the sites and production plants. The electricity used by the energy production plants is partially self-produced and the relevant figures are included in the direct fuel consumptions. If the electricity used exceeds the amount self-produced, electricity is purchased from third parties and accounted for under the indirect energy consumption of the Group, which, in 2020, amounted to 337 GWh, equal to 62,999 TOE (2,637,121 GJ), with an almost constant trend compared to 2019.
| Direct energy consumption by energy source | u.m. | 2020 | 2019 | 2018 |
| Total direct energy consumption (1) | TOE | 1,463,262 | 1,509,743 | 1,264,807 |
| Total direct energy consumption (1) | GJ | 61,252,146 | 63,197,819 | 52,944,833 |
| Natural gas (1) | sm3/000 | 1,723,470 | 1,779,273 | 1,492,759 |
| TOE | 1,440,821 | 1,487,472 | 1,247,874 | |
| Diesel | t | 44 | 36 | 76 |
| TOE | 45 | 37 | 78 | |
| Biogas from landfills, treatment plants and biodigesters (2) | sm3/000 | 30,443 | 28,399 | 27,792 |
| TOE | 11,497 | 10,475 | 10,047 | |
| Fuel for motor vehicles | t | 10,643 | 11,481 | 6,681 |
| TOE | 10,900 | 11,759 | 6,808 |
(1) The data for 2019 and 2018 were restated.
(2) The 2020 data shows an increase due to the entire year consolidation of production from the Cairo Montenotte biodigestion plant, which was considered for only 6 months in 2019 following the acquisition.
Water withdrawals
The water supply to the Group’s sites is made by withdrawing water from surface water bodies (reservoirs, rivers), from the sea and from groundwater pumped from wells and water mains.
In 2020, the Group’s water withdrawals were reduced by approximately 4% compared to 2019.
Water withdrawal by source (m3) (1)
| Withdrawal sources | 2020 | 2019 | 2018 |
| Water mains | 2,449,820 | 2,842,846 | 2,212,067 |
| Surface water | 535,074,260 | 557,654,704 | 496,254,950 |
| Seawater | 9,751,104 | 10,872,000 | (in surface water) |
| Ground water | 7,417,101 | 6,484,966 | 5,829,269 |
| TOTAL | 554,692,285 | 577,854,516 | 504,296,286 |
(1) Since 2019, the new source classification established by the 303-3 GRI 2018 standard has been adopted. The seawater withdrawal for 2018 is included in the surface water. The data for 2018 and 2019 were restated. All withdrawal sources (except seawater) are composed of freshwater (≤1,000 mg/L of total dissolved solids).
Most Group companies have implemented a certified environmental management system (ISO 14001) and the main production sites have EMAS registrations; therefore, they have adopted various procedures for the management of water resources, which represent an operating tool for the management of withdrawals and discharges. The procedures apply to:
- the various types of production processes and/or supplies of services, which require the use of the “water” resource, even for a secondary purpose;
- water withdrawal of any kind and purpose;
- treatments and qualitative modifications of the resource water made for any reason;
- water discharges of any kind, purpose and origin to soil, subsoil, surface water bodies and sewers.
Iren Group pays particular attention to the implementation of initiatives to reduce water withdrawal for industrial and civil use in all of its activities.
In waste-to-energy plants, priority is given to the recovery and recycling of water for combustion slag shut-down and plant cooling.
In energy production, each activity regarding the use of water sources is regulated by legal provisions of the law or authorisations with the responsibility laying in the hands of the Legal Representative of the company or managers, provided with specific powers of attorney and proxies, who have the task of managing and supervising the correct performance of the activities and the correct application of the procedures. Moreover, the “environmental analysis” document, prepared for each site/plant, allows for the identification of the environmental aspects related to water resources and the obligations foreseen by environmental legislations. The analysis also identifies the applicability of the legislation to the Group’s plants as well as the compliance with the regulations in force. The Torino Nord co-generation plant, for example, is equipped with recovery systems for rainwater and condensation produced by the turbine’s air input refrigeration system. The industrial water produced is stored in a tank and used for firefighting purposes, to supply the demineralised water production installation and for plant-related services.
Within the integrated water service, the supply of drinking water is organised on the basis of effectiveness and efficiency criteria and in compliance with the law and resulting concessions. The criteria for the use of resources take into account: authorised quantities, the size of the reserves in the main reservoirs, the quality of the surface water available, the hydrological features of the basins, the data relating to the previous year and data relating to the current year. The supply plan can be modified, reviewed or updated on a monthly basis following an analysis of the data collected during the measurement and monitoring activities in the phases of the process.
Water discharges
The activities carried out by Iren Group generate water discharges, whose management is regulated by the Integrated Environmental Authorisations, the Consolidated Environmental Authorisations and existing legislation:
- industrial discharges (including water used for the cooling of plants);
- integrated water service (in addition to the wastewater treated in the purification service, includes process water from production and purification systems, which do not contain particular pollutants);
- waste management and treatment;
- washing vehicles and industrial areas;
- discharge of domestic water at non-industrial sites.
Most water discharges are composed of water used in the cooling process at thermoelectric plants, which is discharged to surface water (rivers).
Discharges, like withdrawals, are also 4% lower than in 2019.
Water discharges (m3) (1)

(1) Data report the 2019-2020 biennium because the new classification required by 303-4 GRI 2018 standard was adopted from 2019. All discharges (except seawater) are composed of freshwater (≤1,000 mg/L of total dissolved solids). Volumes of water passing through for hydroelectric production are excluded, while for treatment plants, only process water is considered, excluding treated wastewater (see page 83 of the “Sustainability Report”). The data for 2019 has been restated.
Water withdrawn for all processes is almost entirely returned to the environment. Approximately 0.3% of water withdrawn, equal to 1.7 million cubic metres, is consumed in industrial processes. Predominantly water evaporated during production processes (WTE and thermoelectric plants) and used for the district heating networks.
Waste production
Environmental protection is also achieved through the responsible management of waste produced by the Group during its activities, following the principle of prevention aimed at reducing production as much as possible and using the waste produced as a material or energy. The figures of waste produced are communicated on a yearly basis to the Chamber of Commerce through the environmental declaration form.
The Group’s main waste-generating activities are:
- the treatment and processing of urban and special waste that the Group manages for communities and private bodies (e.g. leachate generated at landfills, ash and slag from waste-to-energy plants, etc.);
- the treatment and purification of water in the management of the integrated water service for the municipalities served by the Group (e.g. sludge, sand);
- operation and maintenance of heat and energy production plants and electricity and gas distribution networks.
Systems of sorted waste collection, aiming to increase material recycling, have been installed in all Group sites. Policies limiting the use of paper have also been drawn up and implemented through dematerialisation projects and computerisation of processes.
Waste produced by Group processes (t)

In 2020, the Group produced 605,704 tons of waste, of which 521,396 tons was non-hazardous, an overall reduction of 5% compared to 2019.
| Waste generated by business and main materials (t) (1) | 2020 |
| Environmental Services | 437,406 |
| of which non-hazardous | 353,433 |
| - slags | 173,558 |
| - leachate | 71,536 |
| - sludge | 7,534 |
| - sands | 4,548 |
| - metals | 8,238 |
| - other waste | 88,019 |
| of which hazardous | 83,973 |
| Water treatment and purification service | 167,185 |
| of which non-hazardous | 167,072 |
| - sludge | 143,727 |
| - sands | 5,762 |
| - sieve/muddle | 5,637 |
| - other waste | 11,946 |
| of which hazardous | 113 |
| Energy production | 892 |
| of which hazardous | 188 |
| Other non-hazardous waste | 187 |
| Other hazardous waste | 34 |
| TOTAL | 605,704 |
(1) The difference between waste produced and their destination (next tables) is due to temporary storage. As of 2020, the breakdown of waste generated required by the new GRI 306 standard has been adopted, so it is not possible to provide a comparison with the three years.
In addition to complying with the legislative framework, the waste cycle is closed with a particular focus on the enhancement of the waste resource (recycling, material recovery and preparation for re-use) as opposed to disposal, where priority is given to the energy recovery of waste that the Group cannot usefully recover, and only as a last resort to landfill.
In 2020, approximately 59% of the Group’s waste was diverted from disposal and sent to the material recovery chain.
Waste diverted from disposal

Details of waste diverted from disposal, thanks to treatment in Group or third-party plants, are given in the table below.
| Waste diverted form disposal (t) (1) | Group plants | Third-party plants |
| Preparing for reuse | 46,311 | 128,108 |
| of which hazardous | 48 | 23,708 |
| Recycling | 192 | 168,792 |
| of which hazardous | - | 24,543 |
| Other recovery operations | 47 | 13,123 |
| of which hazardous | 13 | 275 |
| TOTAL | 46,550 | 310,023 |
(1) As of 2020, the breakdown of waste generated required by the new GRI 306 standard has been adopted; therefore, a comparison with the three years is not possible.
The remainder of the waste produced by the Group (approximately 41% of the total) was disposed of in the manner and the quantities indicated in the following graph and table.
Waste disposed

All waste intended for incineration has been disposed of in plants with energy recovery.
| Waste disposed (t) (1) | Group plants | Third-party plants |
| Incineration with energy recovery | 36,301 | 828 |
| of which hazardous | 4 | - |
| Landfill | 7,725 | 4,864 |
| of which hazardous | - | - |
| Other disposal operations | 124,832 | 74,692 |
| of which hazardous | 8,616 | 27,112 |
| Total | 168,858 | 80,384 |
(1) As of 2020, the breakdown of waste generated required by the new GRI 306 standard has been adopted; therefore, a comparison with the three years is not possible.
Atmospheric emissions
Iren Group activities generate atmospheric emissions both directly, concerning production processes, and indirectly, from the supply of electricity from third parties. Reporting will therefore consider:
- scope 1: all direct emissions from sources owned by the Group, i.e. CO2 emissions generated from fuels burned at the plants for the production of energy and heat, those originating from the company fleet and those deriving from natural gas consumption to produce heat for the heating systems of the various office buildings and/or for other activities in support of production;
- scope 2: CO2 emissions from indirect consumption of the Group; i.e. emissions generated from the purchase of electricity consumed in the Group’s plants and offices from third-party suppliers;
- scope 3: all emissions that, albeit related to core and business activities, are not directly controlled by the Group.
Total CO2 emissions(t)

Scope 1 emissions
| Direct CO2 emissions – Scope 1 (t) | 2020 | 2019 | 2018 |
| Direct emissions from production plants | 3,856,284 | 3,917,267 | 3,325,895 |
| - of which from cogeneration, thermal and thermoelectric power plants | 3,418,020 | 3,484,516 | 2,911,546 |
| - of which from waste-to-energy plants (non-biogenic portion) | 438,232 | 432,720 | 414,305 |
| - of which other combustion reactions for process uses or services | 32 | 31 | 44 |
| Other direct emissions | 6,922 | 5,215 | 5,938 |
| Emissions from company vehicles | 18,456 | 20,517 | 11,205 |
| TOTAL | 3,881,662 | 3,942,999 | 3,343,038 |
| Direct emissions of biogenic CO2 from production plants (t) | 2020 | 2019 | 2018 |
| Waste-to-energy plants (biogenic portion) | 456,119 | 450,383 | 431,216 |
| Landfills and treatment plants | 24,915 | 21,444 | 22,224 |
| TOTAL | 481,034 | 471,827 | 453,440 |
In 2020, direct emissions showed a decrease compared to the previous year that is affected by the overall reduction in energy production, due to climate effects and lower national consumption concerning the Covid-19 emergency, and by the improvement in emissions linked to the traffic of the company vehicles due to the progressive electrification of the vehicle fleet and lower mileage, also in this case related to the pandemic.
Scope 2 emissions
| CO2 emissions – Scope 2 (t) (1) | 2020 | 2019 | 2018 |
| Emissions from electricity purchased for process activities | 93,819 | 99,016 | 103,977 |
| Emissions from electricity purchased for office activities | 5,901 | 6,567 | 7,015 |
| TOTAL | 99,720 | 105,583 | 110,992 |
(1) Emissions are calculated by multiplying the electricity purchased from third parties by the emission factor of the national electricity mix, which for 2020 was 296 g CO2/kWh, for 2019 was 316 g CO2/kWh and for 2018 was 321 g CO2/kWh (Source: NIR2020_ITALY). This factor accounts for the mix of various production sources for the electricity purchased.
In 2020, there was a slight reduction in scope 2 emissions compared to the previous year. The Group has set a target in its Business Plan to reduce these emissions by 36% by 2025 and achieve net-zero scope 2 emissions in 2035.
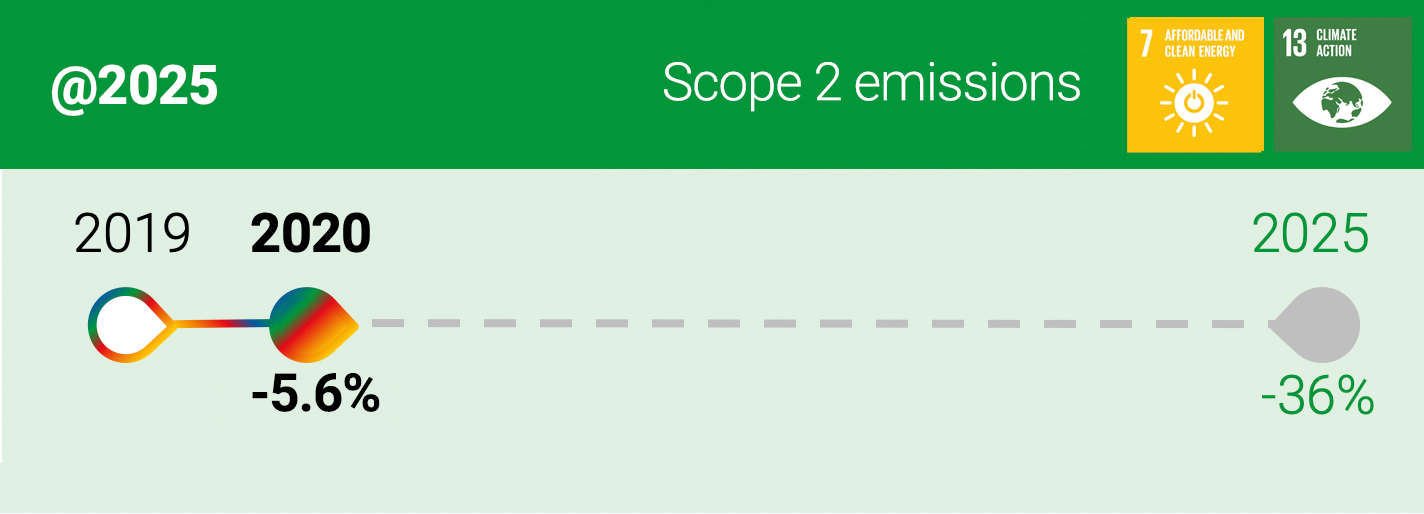
The plan will achieve a result both through the purchase of certified green electricity for the Group’s processes and activities and the installation of new photovoltaic systems on the Company’s premises that will help reduce the amount of energy purchased from third parties.
In 2020, the Group set a target of reducing scope 2 emissions by 2025.
Scope 3 emissions
The Group is indirectly responsible for emissions produced by its suppliers and customers and by the entire value chain.
For this reason, each year, the Group aims to extend its emissions reporting boundary, analysing in greater depth the categories proposed by the GHG Protocol methodology.
In 2020, the analysis of scope 3 emissions was further refined.
Overall, in 2020, scope 3 emissions are up compared to 2019 due to the refinement of calculation methodologies that broadened the boundary of emissions reported. In particular, the most significant increase is recorded for emissions from purchased goods and services, calculated on orders to suppliers in the year; this is due both to the rise in total orders of approximately 46% compared to 2019 and the expansion of the coverage of the analysis from about 75% of orders in 2019 to over 95% in 2020.
| CO2 emissions – Scope 3 (t) (1) | 2020 | 2019 | 2018 |
| Goods and services purchased (1) | 844,572 | 549,970 | 466,814 |
| Capital assets (plants and machinery) | 3,256 | 38 | 773 |
| Use of fuel and energy (not included in Scope 1 and 2 emissions) (2) | 480,459 | 499,719 | 422,142 |
| Upstream transport and distribution services (3) | 3,998 | 636 | 550 |
| Transport of waste produced (4) | 1,426 | 1,492 | 1,367 |
| Business trips (5) | 137 | 52 | 428 |
| Employee commutes (6) | 12,750 | 12,750 | 12,750 |
| Use of products sold (7) | 2,464,655 | 2,519,909 | 2,297,380 |
| Downstream leased assets (8) | 8,602 | 7,806 | 8,700 |
| Investments (9) | 10,271 | 41,400 | 39,473 |
| TOTAL | 3,830,126 | 3,633,772 | 3,250,377 |
(1) Supplier orders in the year have been analysed and the emissions deriving from the production of each type of goods and services purchased were estimated.
(2) All direct and indirect consumption (natural gas, diesel, electricity and vehicle fuels) was calculated and Well-to-Tank (WTT) emission factors were used in order to quantify total emissions due to the extraction, processing and transport of the fuels used.
(3) It is calculated from the total orders to suppliers for transportation services.
(4) The weight of waste produced and diverted from disposal (then sent for recovery/recycling) was multiplied by the emission factor 4 kg CO2/t waste.
(5) The emissions were calculated by analysing orders placed in 2020 for trains, planes, hotels, etc.
(6) Data estimated on the basis of the average number of employees (between 5,000 and 10,000).
(7) The volumes of gas sold to end customers, which are not produced by the Group and therefore not relevant to Scope 1 emissions, were considered and multiplied by the emission factor (1.972 t CO2/1000 sm3).
(8) Data calculated on the basis of revenues from active leases and rental agreements.
(9) Direct and indirect emissions of certain non-consolidated companies multiplied by the percentage equity held by the Group. The company Gaia continues to be considered in 2020, while the OLT company sold by the Group at the beginning of the year is no longer included.
Other atmospheric emissions from production plants concern sulphur oxides (SOX), nitrogen oxides (NOX), particulates and methane (CH4).
| Atmospheric emissions (t) | 2020 | 2019 | 2018 |
| SOX(1) | 62.91 | 25.36 | 9.80 |
| NOX | 1,030.25 | 996.11 | 809.65 |
| Particulates | 10.64 | 9.96 | 17.70 |
| CH4 | 5,929.47 | 5,763.08 | 5,867.79 |
(1) The data is calculated from the flue gas volume at the stack and the concentration measured by the emission analysis performed by an accredited external laboratory. The determined parameter, which describes the condition of a short period, is then extended to the whole year. This method of calculation may lead to significant differences from one year to the next.
(2) The change in CH4 emissions is related to increased biogas production from landfills.
Ozone depleting emissions
Ozone-depleting substances are normally contained in the refrigerants of air conditioning systems. The only harmful substance used by Iren Group is R22 (monochlorofluoromethane), which is present in plants either owned by the Group or managed for third parties (e.g. air-conditioner cooling circuits). Emissions of this substance are monitored on the basis of the quantities of coolant added following periodic maintenance checks (topping up). In order to avoid any dispersions from the Company’s air conditioning equipment, all the initiatives envisaged by the Italian Presidential Decree 147/06 have been activated. All equipment was registered, indicating the gases contained and the respective quantities, and subjected to periodic checks to ensure that there are no leaks, as well as to check its correct functioning and cleanliness. In 2020, the Group replaced all split air conditioners with R22 gas in the Emilia area, which will continue in 2021 in the Liguria and Piedmont areas.
PCB management
Polychlorinated biphenyls (PCBs) are aromatic compounds – consisting of toxic chlorinated molecules that are persistent organic pollutants with bio-accumulative properties – found in transformers and other electrical equipment. To avoid forms of pollution or dispersion of these substances, Iren Group regularly and continuously updates the number of machines containing insulating oil and the quantity contained in them, in accordance with registration and cataloguing procedures. The environmental performance improvement programme in the field of electricity distribution provides for the gradual decommissioning of electrical devices containing PCB/PCT contaminated oil. The goal is to keep the disposal trend steady until the elimination of all the contaminated devices.
In 2020, 16 electrical and electronic equipment containing oil contaminated with PCBs at concentrations between 50 and 500 ppm were sent for disposal, in the quantities indicated in the table.
| Oil containing PCB disposed of (kg) (1) | 2020 | 2019 | 2018 |
| w ith PCB content of over 0.05% | 0 | 0 | 0 |
| with PCB content between 0.005% and 0.05% | 3,560 | 3,043 | 2,197 |
| TOTAL | 3,560 | 3,043 | 2,197 |
(1) The total amount of oil containing PCB in transformers and other equipment as at 31/12/2020 is approximately 54,966 kg.
Measures taken to reduce acoustic impact
Iren Group takes steps to monitor, evaluate and mitigate noise emissions throughout the life cycle of its plants and infrastructure, supported by specialist technicians, and dedicates time and resources to limit the acoustic impact of its activities, including through mitigation measures (e.g. soundproofing panels, silencers). In order to verify that the limits laid down by current legislation are respected, specific Acoustic Impact Assessments are carried out at each energy production site, either as a preventive measure or on existing situations, whenever:
- it is decided to build, modify or upgrade a construction project;
- it is intended to start a new business;
- an application is made for the issuance of permits for the construction of new plants, the infrastructure of productive activities or commercial services;
- a public body or a municipality requests it.
In cases where the specified limits were exceeded, acoustic decontamination measures were taken on the most significant sources to bring the noise emitted within the legal limit. Periodic phonometric tests are also carried out at the perimeters of the sites or in proximity of the sensitive receptors; moreover, upon receiving reports or complaints from citizens, we implement appropriate measurements to assess the need for specific mitigation measures.
At gas distribution plants, campaigns to measure the effects of noise produced on the surrounding environment in 2020 found no critical issues.
In the distribution of electricity, the Group found a primary substation to be marginally over the permitted noise emission limits, for which the design of the necessary mitigation works has commenced.
The subject of reducing the acoustic impact is normally not particularly relevant for the integrated water service. Despite this, machinery and equipment (compressors, grills, etc.) are replaced during the unscheduled maintenance interventions with models producing lower levels of acoustic impact or greater degree of soundproofing.
Lastly, regarding environmental services, phonometric tests are periodically carried out on waste collection, street sweeping and collection centres. In particular, in the waste collection sector, the Group is adopting new methods with vehicles with low acoustic impacts, such as electric vehicles. For waste-to-energy plants periodic acoustic monitoring campaigns are carried out. To date, the results of the investigations conducted show that the limits have been respected.
Electromagnetic fields
For several years now, Iren Group has been measuring electromagnetic fields, which involve:
- primary electricity power plants and stations;
- overhead and underground HV power lines;
- MV/MV and MV/LV electricity substations installed in schools, hospitals, parks, or with specific load characteristics;
- MV/LV electricity substations with a higher capacity;
- office buildings of Group Companies.
During inspections, the location of the substation is checked, as well as the electrical equipment it contains with respect to any sensitive adjacent buildings and any potentially hazardous situations found in the substation that are environmental and electrical. In 2020, the design and construction of new MV/LV substations continued to reduce the population’s exposure to emissions from electromagnetic fields (EMF).
Material used
The Group’s production and service activities involve the use of materials acquired from external suppliers, including, for example, products for cooling and lubricating plants and machinery, substances for treating water, and reagents for waste treatment and waste-to-energy processes. In 2020, the Group used 212,098 tons of process materials in total, with a marginal proportion of renewable materials, considering the type of processes managed.
As part of the Group’s supplier certification process, certain qualitative information is specifically requested regarding the use of materials with low emissions, low energy consumption, of recycled or recyclable material and the eventual adoption of procedures for the storage and collection of recyclable materials in order to guarantee recycling.