Water production and distribution
The supply of water for the distribution of drinking water is carried out in compliance with regulations and concessions and according to effectiveness and efficiency criteria.
The criteria for using resources consider several factors (authorised quantities, size of reserves in the main reservoirs, the quality of available surface water, the hydrological features of the basins, final data relating to the previous year and the current year).
Modern automation and remote-control equipment ensure the water catchment, purification, and lifting systems’ best operation.
The total volume of water fed into the network in 2020 is down compared to last year.
| Water fed into the network (thousands of m3) | 2020 | 2019 | 2018 |
| Piacenza | 31,041 | 32,239 | 32,122 |
| Parma | 38,095 | 38,156 | 38,024 |
| Reggio Emilia | 45,818 | 46,159 | 44,982 |
| Vercelli | 8,916 | 8,744 | 8,819 |
| Genoa | 90,605 | 95,719 | 99,045 |
| Savona | 19,093 | 19,057 | 19,752 |
| Imperia | 3,080 | 3,462 | 3,515 |
| La Spezia (1) | 38,002 | 40,296 | 30,865 |
| Other provinces (2) | 4,956 | 6,638 | 15,826 |
| TOTAL | 279,606 | 290,470 | 292,950 |
(1) In 2018, Acam Acque is only considered for the period of consolidation (from April 1).
(2) The significant reduction compared to 2018 is due to the termination of service in the provinces of Alessandria, Aosta, Novara, Brescia, Pavia and Verona. The provinces of Asti, Cuneo, Mantua remain included.
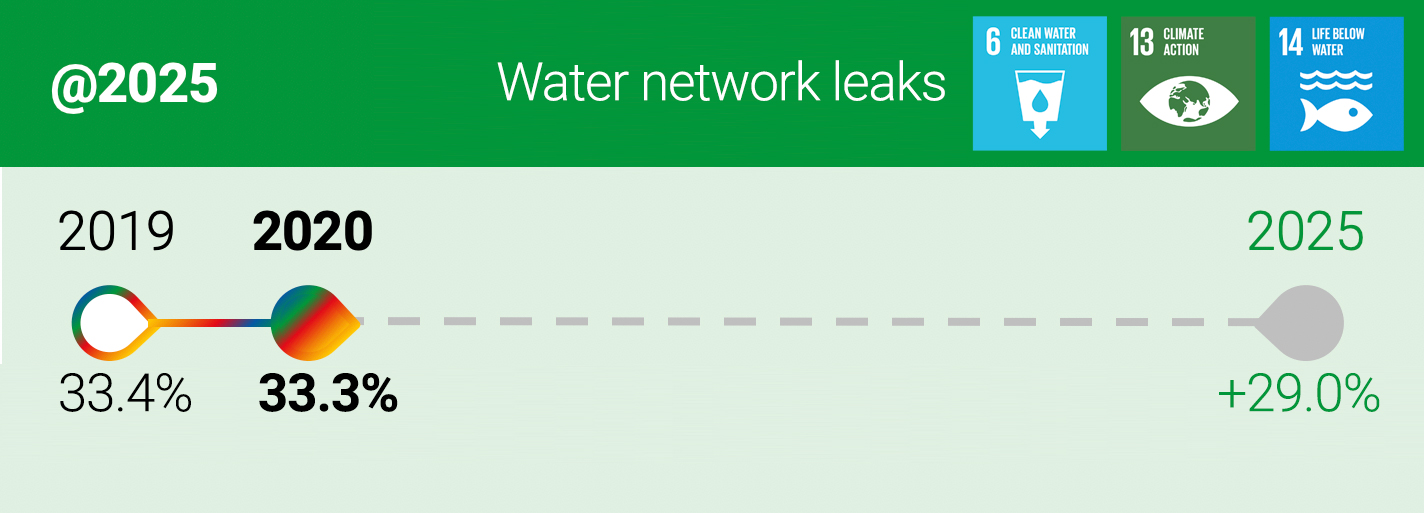
The percentage of network leaks stands at 33.3%, compared to a national average of 43.7% (ISTAT 2019 data).
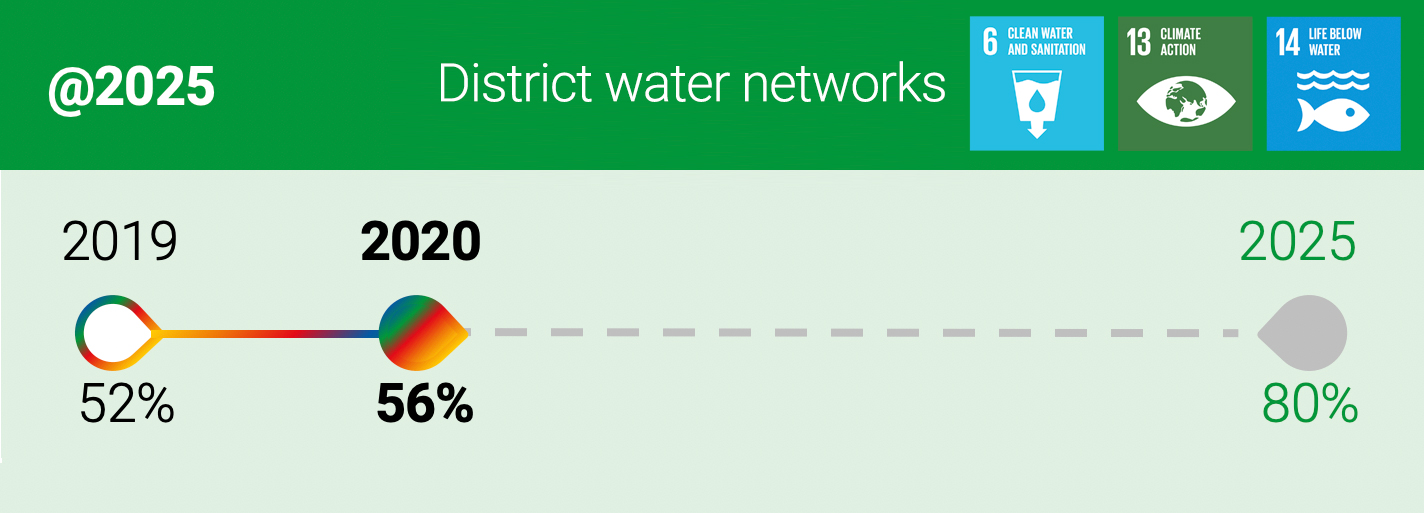
Among the initiatives for the reduction of dispersions in water networks, the Group is developing district planning. This technique involves dividing the networks into small homogeneous areas, the so-called “districts”, which allow daily monitoring and constant analysis of hydraulic parameters. In this way, the instrumental leak detection campaigns are punctual and targeted only to the districts on which the monitoring has detected hidden leaks. Currently, 56% of the total managed network has been associated to a district in progression according to the objectives defined by 2025. District planning also produces a benefit in terms of reducing energy consumption: it saved 523 TOE in 2020.
Sewerage and treatment quality
Urban wastewater from public sewers is treated at 1,356 treatment plants of varying capacity and type. In the central plants, pre-treatments are carried out to remove coarse matter, sand and oils, primary treatments to remove settleable solids and traditional secondary and tertiary treatments for nitrogen removal.
The Group also manages several phyto-purification plants that use plants’ treatment activity and are used both for the purification of sewage (sub-surface flow system) and for the refinement of water treated in traditional treatment plants (surface flow systems).
Wastewater treated (thousand m3)

(1) In Liguria, the Group does not manage the sewerage and treatment service in the Savona and Imperia areas.
For the volumes of water treated and the calculation of pollutant reduction, all the Group’s treatment plants with a capacity of more than 2,000 residents equivalent are considered.
Pollutant reduction – Geographical area (%)
Emilia-Romagna

Liguria

Piedmont

1,365 treatment plants operated by tge Group that contribute to improving the conditions of rivers, streams and seas.
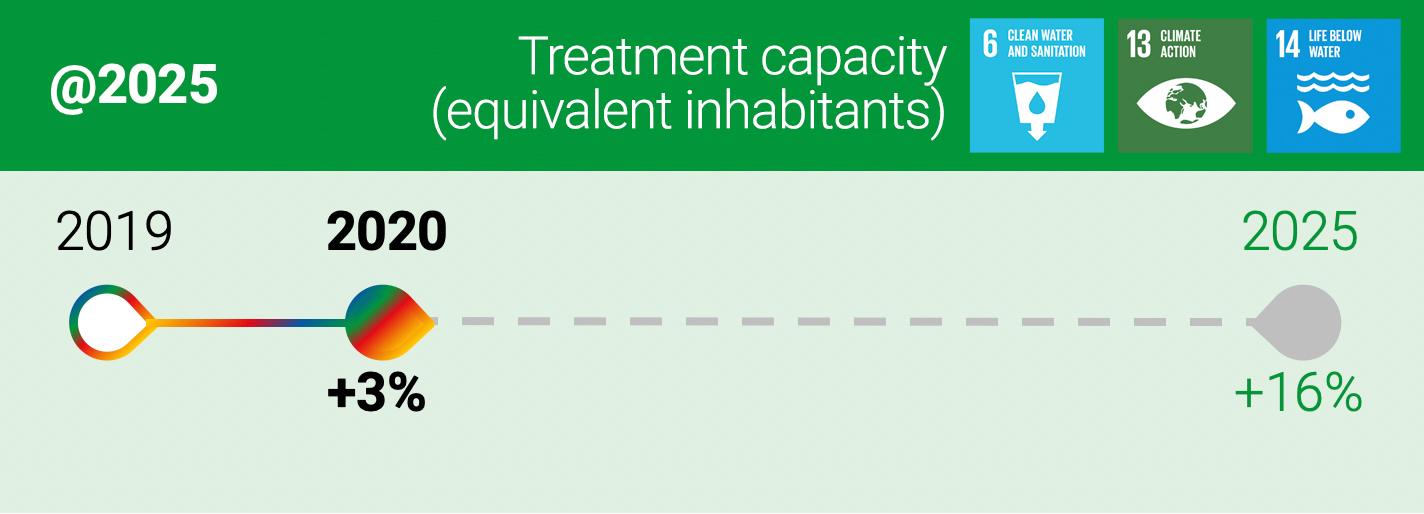
The Group’s objectives are to increase purification capacity, increasing the plants’ potential to ensure increasingly efficient service and improving wastewater management’s environmental impact.
Investments made in 2020 in this direction also contribute to the achievement of the set objectives.
Receiving bodies of treated wastewater
All the water bodies that receive wastewater treated by the Group in the Emilia and Piedmont regions fall within the Po river basin.
The land lies within an area declared as sensitive so the plants, depending on their size, are subject to the application of the strictest nitrogen and phosphorus limits.
The wastewater treated by the treatment plants in Liguria’s served areas is discharged into the Ligurian Sea (mainly the Gulf of Genoa, the Gulf of Tigullio and the Gulf of La Spezia).